How to visualize the results of local_thickness on a 3D image? #491


|
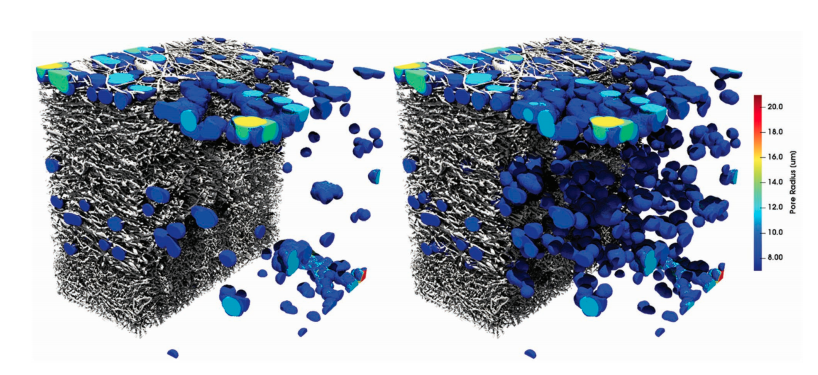
Hello, could you help me, how to graph the Local thickness in 3D, I read a paper of your property, that they used that method, I would like to be able to graph with the image shown below: |
Replies: 3 comments 2 replies

|
We used paraview for that. You can save images as tiffs, and opening them directly in paraview. You then use a 'threshold' to remove parts you don't want. also, be sure to enable ray tracing to get the photorealistic shadows ;-) |
|
Could you help me with an example to guide me, I have created the tiff with tifffile, but it only shows a slice in paraview |

|
You probably only saved 1 slice. Use the imageio package: |

|
Try this, to generate it: blobs = ps.generators.blobs(shape=[200,200,200] porosity=0.5, blobiness=1)
thk = ps.filters.local_thickness(blobs, mode='dt')
a=np.array(thk, dtype=np.float32)
tif.imsave('BLOB1.tif', a, bigtiff=True)
Thank you very much for the recommendations |


|
that looks very pretty! Well done. |


You probably only saved 1 slice. Use the imageio package:
imageio.volsave('filename.tif', np.array(tif_array, dtype=np.int32)